

DESIGN AND CONTROL OF LOGISTIC PROCESSES SUPPORTED BY DIGITAL FACTORY TOOLS
Jozef Hnát [1], Jozef Herčko[2]
Abstract⎯Design of the logistic systems represents an important part of the production system design. Therefore it is necessary to think and to find right strategy for logistics. Not only technologies directly connected to execution of different logistic operations, but also technologies used in the preproduction phase of planning and in the control of logistic processes play important role as enablers for the high efficiency in the logistic processes. In our organization we use different digital factory tools in preproduction phase and this article is focused on some of them. In the conceptual planning we use software Tecnomatix Process Designer which facilitates the design and validation of manufacturing processes from concept and detailed engineering through production planning. Detailed design of production and logistic systems and material flow optimization is done subsequently in Tecnomatix FactoryCAD/FLOW tools. Very important part is control and monitoring of the system. This is especially important in case of using autonomous and intelligent systems in logistics (for example AGV - Automated Guided Vehicle). By using virtual plant models and their linking to the real objects in production system we can talk about virtualization which is one of the basic principles in Industry 4.0.
Keywords⎯Automated guided vehicle, Control of logistic processes, Design of logistic processes, Intelligent logistic
INTRODUCTIONProduction can`t exist without supply of material from the warehouse to the workplace and transport of products from the workplace to the warehouse of finished products. Therefore it is necessary to create appropriate routes, to define appropriate transported quantities, to choose the technology to be used in warehouses for transport, etc. Proposed solutions have to be verified and validated in the preproduction phase. Different powerful software solutions are available and can be used for modeling and simulation of our ideas.
In the first phase of modeling of production system an ideal layout of workplaces is designed. In the ideal layout the real space requirements of workplaces, input – output points of the production system or other constraints (e.g. space restrictions) are not taken into account. Different algorithms can be used to find optimal solution for ideal layout. These algorithms usually minimize the total transport capacity and intensity of transport between all workplaces.
In the second step ideal layout is transformed into real conceptual layout and respects:
- real shape and dimensions of the machine / workplace and workplaces operating areas (represented by 2D / 3D model),
- basic material flow in the production hall and its connection to the material flow between different halls (input, output, stores location),
- transport and material handling needs (handling units in production, transport network and streets dimensioning, cranes paths, etc.),
- placement of building elements (columns, walls) and permanent [3].
Tecnomatix Process Designer facilitates the authoring and validation of manufacturing processes from concept and detailed engineering through production planning. Process Designer enables manufacturers to develop, capture and re-use process plans. Furthermore, process design teams can compare alternatives to develop and select best manufacturing strategies that meet specific business requirements. In a 3D virtual environment, Process Designer is a collaborative platform that enables distributed enterprise teams to evaluate process plans and alternatives, optimize and estimate throughput and costs, plan for variants and changes and coordinate production resources [5].
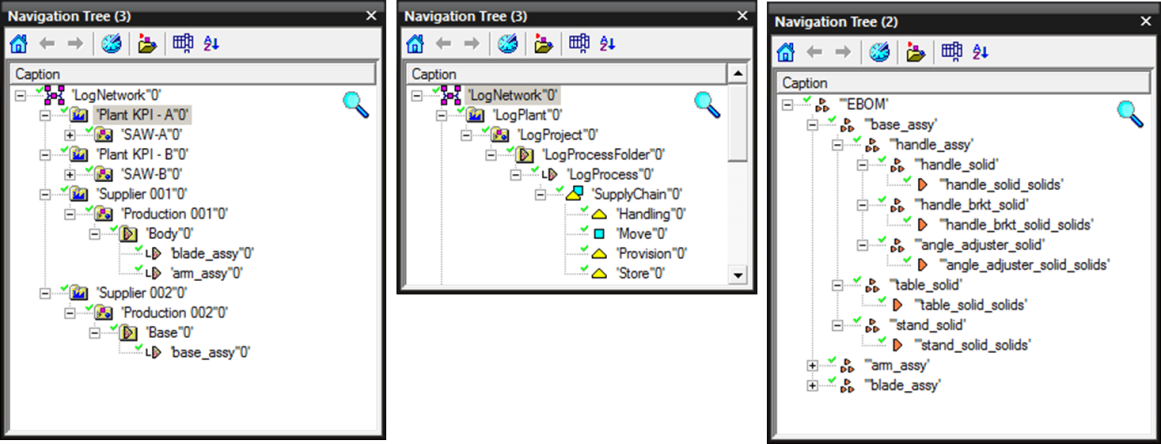
Part of this solution is the Logistics module which provides users with a basic data model of logistic objects, allowing them to build logistics-specific planning projects and manage the relevant data.
In the first phase we can start with network planning. In this phase logistics planners are allowed to define logistic networks and to calculate production rates per part family. This requires to use following steps:
- Setup the network structure.
- Setup the part structure (BOM).
- Setup one resource per logistic plant.
- Assign the resource which represents the logistic plant to the logistic plant of the network structure.
- Assign the produced parts to the logistic plant project and define the production rate.
- Create part families aically out of the BOM. One part family is created for each part in the BOM, and the relevant part is assigned to the part family. Alternatively, the part families can be defined in a library and copied below the logistic project. Based on the information you defined, the system calculates the required transportation relations between the plants. The calculated transportation relations include the calculated number of products and required parts.
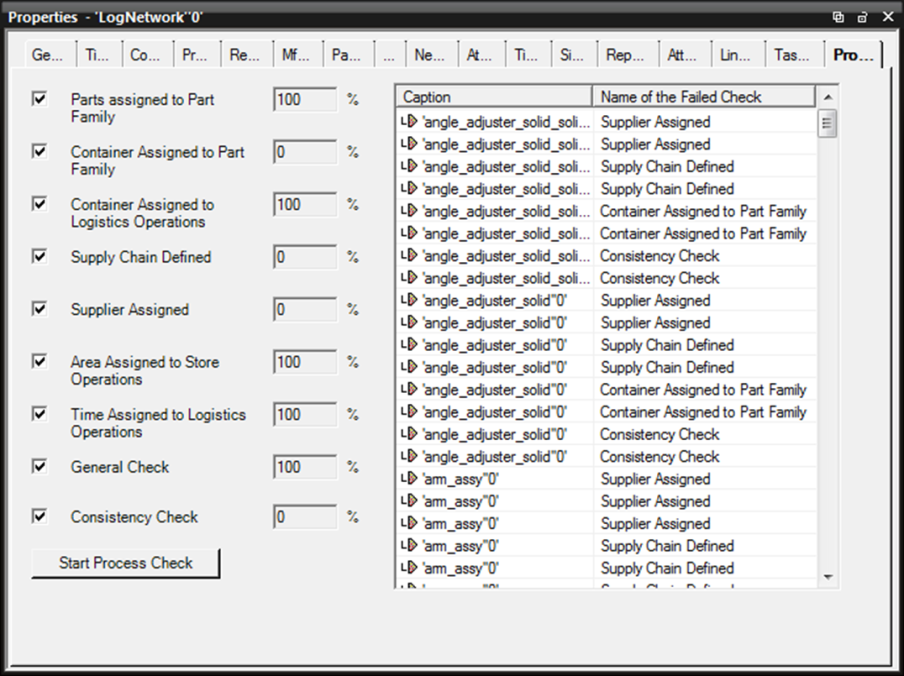
Logistics planners can open the Process Check tab (Fig.2.) to view progress of the logistic planning. The Process Check tab offers the following predefined checks:
- Parts assigned to LogProcess: Is there at least one part assigned to the LogProcess object?
- Container assigned LogProcess: Is there exactly one Container assigned to the LogProcess object?
- Container assigned to logistics operations: Is there exactly one Container assigned to the Move/Store operations of the supply chain of the LogProcess?
- Supply Chain defined: Is there a supply chain defined for the LogProcess?
- Supplier assigned: Is a supplier assigned to the LogProcess?
- Areas assigned to store operations: Are there LogAreas assigned to the store operations of the supply chain?
- Times assigned to logistics operations: Are there times assigned to the logistics operations (do all logistic operations of the supply chains have an allocated time > 0).
- General check that assigned container, supplier, areas, etc., are from the correct defined library: The system checks whether all assigned resources of the following types - LogArea, LogContainer, Supplier, Vehicle, Transporter, SupplyChains (for linked supply chains) belong to the respective library of the plant, under which the LogProcess resides. The libraries are taken from fields such as LogPlant,LibrarySuppliers, etc.
- Consistency check to verify the logistics plan against the production plan to find any inconsistencies. The check is based on the use of the same parts and logistics areas by both production planning and logistics planning. A logistics plan is consistent if the parts and the corresponding logistics areas are assigned to the same station as in the production plan.
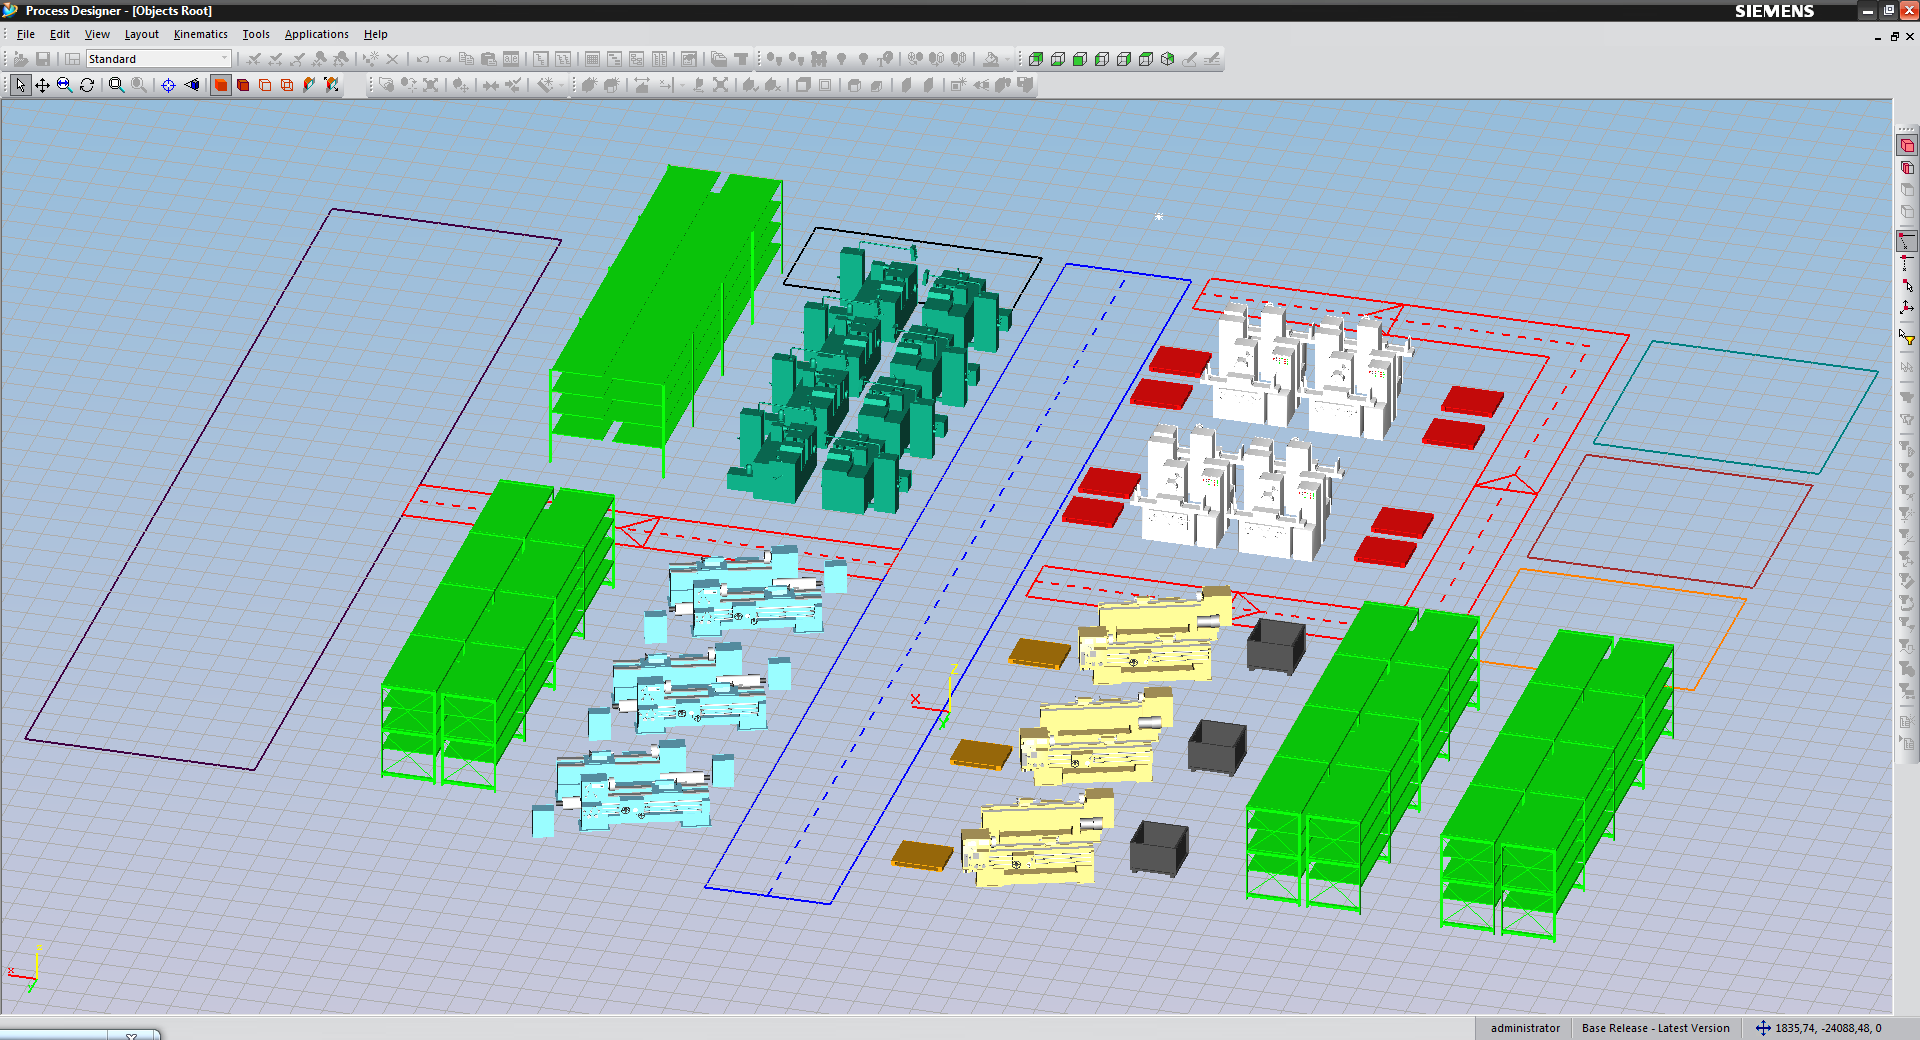
Logistics areas and tracks features enable to build a logistic path network and logistics areas. Logistics planners can describe full area and path networks by drawing areas and tracks and connecting them, using connection points, to other logistic areas or tracks. Using these commands logistics planners can define the direction of the tracks, and to set them as one-way or two-way. Defined path networks can be used as the basis for calculations of route and transport time.
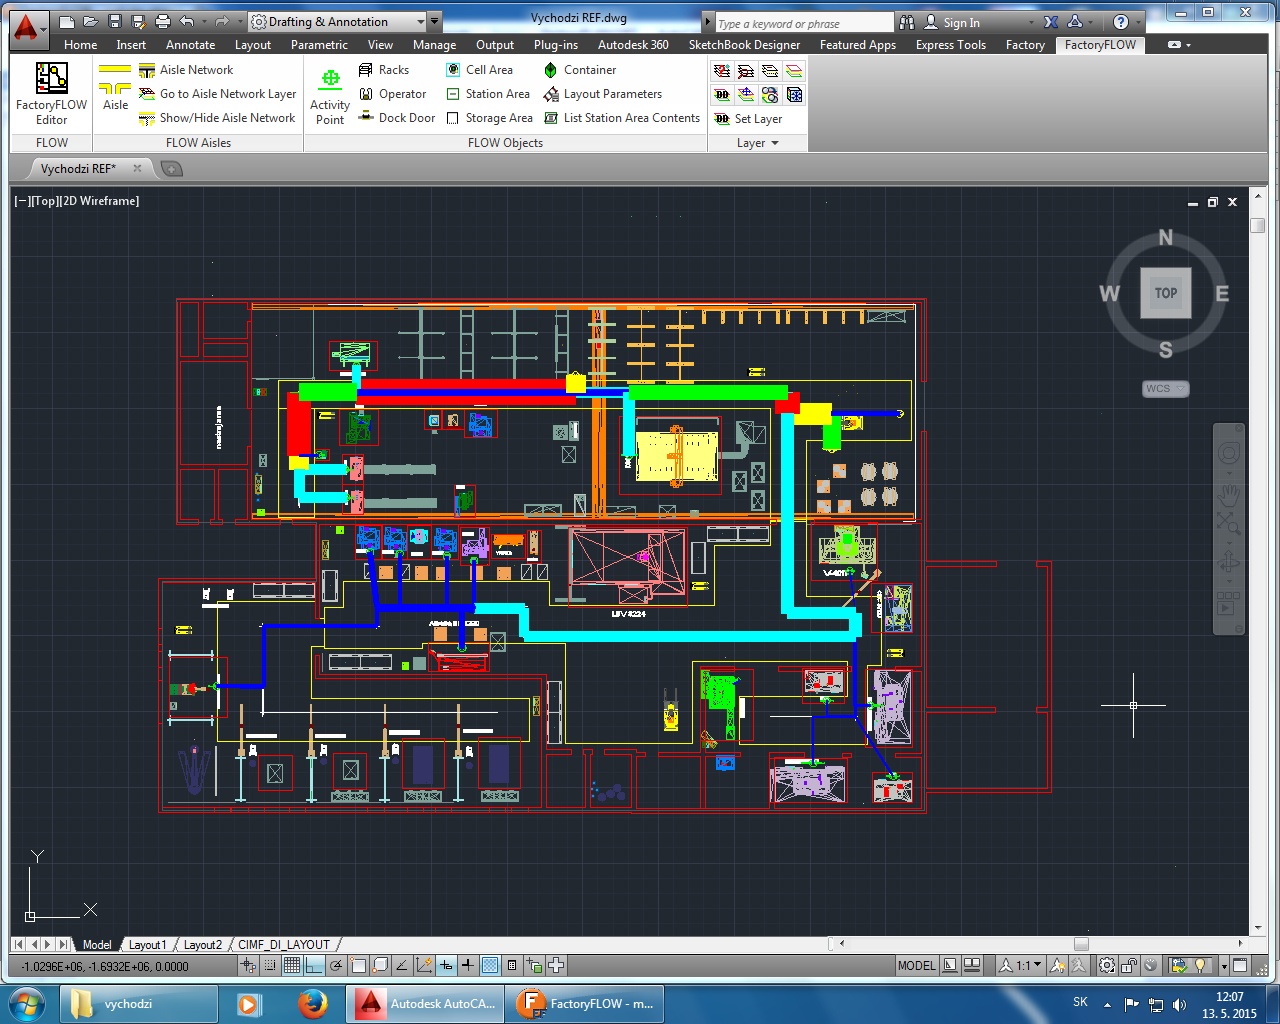
Basic commands for drawing, deleting, showing and hiding all logistics areas and logistics tracks can be seen and designed directly in the 3D layout of production system (Fig.3.).
DETAILED DESIG OF LOGISTIC SYSTEM IN TECHNOMATIX FACTORY CAD/FLOWAfter conceptual solution has been proposed, we can start with detailed design of logistic and production system. In this phase we use software Tecnomatix Factory CAD and Factory FLOW. Instead of having to draw lines, arcs, and circles, Factory CAD allows us to work with "smart objects" that represent virtually all of the resources used in a Factory, from floor and overhead conveyors, mezzanines and cranes to material handling containers and operators. With these objects, we can "snap" together a layout model without wasting time drawing the equipment. Tecnomatix FactoryFLOW graphical material handling system helps us(industrial engineers) to optimize plant layouts based on material flow distances, frequencies, and associated costs.Here they are used the analysis of transport routes, requirements for storage of materials, specifications of equipment for materials handling and information about components handling units for a given production system layout.
Using the application FactoryFLOW we can reach much better decisions, effective plant layouts can be designed, with shorter distances for the transport of components, optimal batch sizes and inventory levels. Also better communication can be achieved. All this makes for higher efficiency and productivity of manufacturing. The connection between FactoryCAD and FactoryFLOW software is probably the most straightforward of all Siemens Tecnomatix software solutions. They represent extension of the AutoCAD and run under its interface. Using libraries and FactoryCAD tools, 3D model of the production system is built. In the production system there are defined various "Activity points", i.e. points where specific activities are running (workstations, storage, networks of material flow, input-output places and others. Tecnomatix FactoryFLOW uses production layout drown in the FactoryCAD. Another source of information for analysis is a tree structure that contains information concerning the product and its parts, information about activities carried out and information on the transport and handling equipment.
Basic data needed to carry out analyzes in FactoryFLOW are:
- production layout in the form of AutoCAD drawing,
- information on production volumes,
- material flow of individual products and its parts,
- information on handling equipment,
- information on the handling material activities.
FactoryFLOW is a software application that generates material flows, aisles utilization charts and various outputreports. Graphical representation of information flow allows us to easyly identify following:
- critical path,
- flows of production activity,
- requirements for storage rooms,
- requirements for the handling of materials,
- potential barriers in the material flow.
Such presentation of material flow and material handling operations can significantly increase understanding ofproduction system. FactoryFLOW enables quick and easy modeling of changes in the production and logistics system layout,material flow direction, volume of production and systems for material handling.
Main goals of FactoryFLOW analysis are:
- evaluation of requests for material handling,
- reduction of not value adding operations,
- reduction of the overall transportation length,
- improvement of transshipment,
- reduction of work in process level,
- modification of material flows for JIT or for group technology
- identification of requirements for storage space,
- analysis of the feasibility of pedestrian pathways.
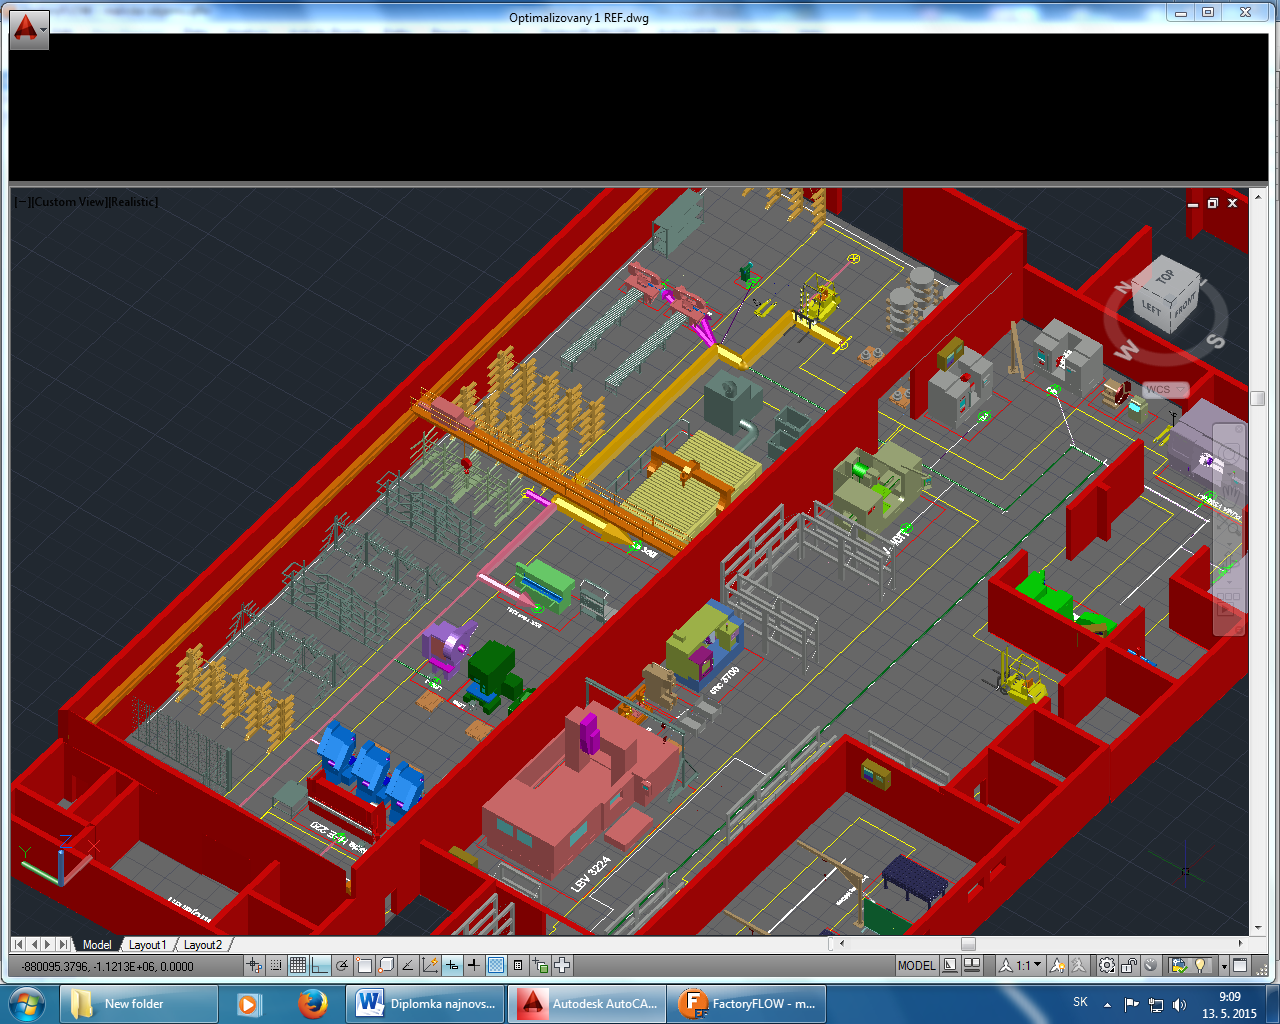
Between the main Factory-FLOW outputs belongSankey diagram of material flow in the production layout, Distance Intensity Chart (DI Diagram), utilization diagrams and reports.
Sankey diagram of material flow in the production layout.Generally Sankey diagrams are a specific type of flow diagram, in which the width of the arrows is shown proportionally to the flow quantity. In our case Sankey diagram is a complex picture of material flow that shows the direction, length, intensity and cruising. It demonstrates the suitability of the proposed transport system. Sankey diagram chart formation is preceded by filling chessboard table of transport relations. The thickness of lines is displayed in the default scale, e.g.: pcs / month. For better orientation in the diagram, FactoryFLOW uses different color for material flows of different products. Sankey diagram is updated along with changes done in the production layout (Fig.4.).
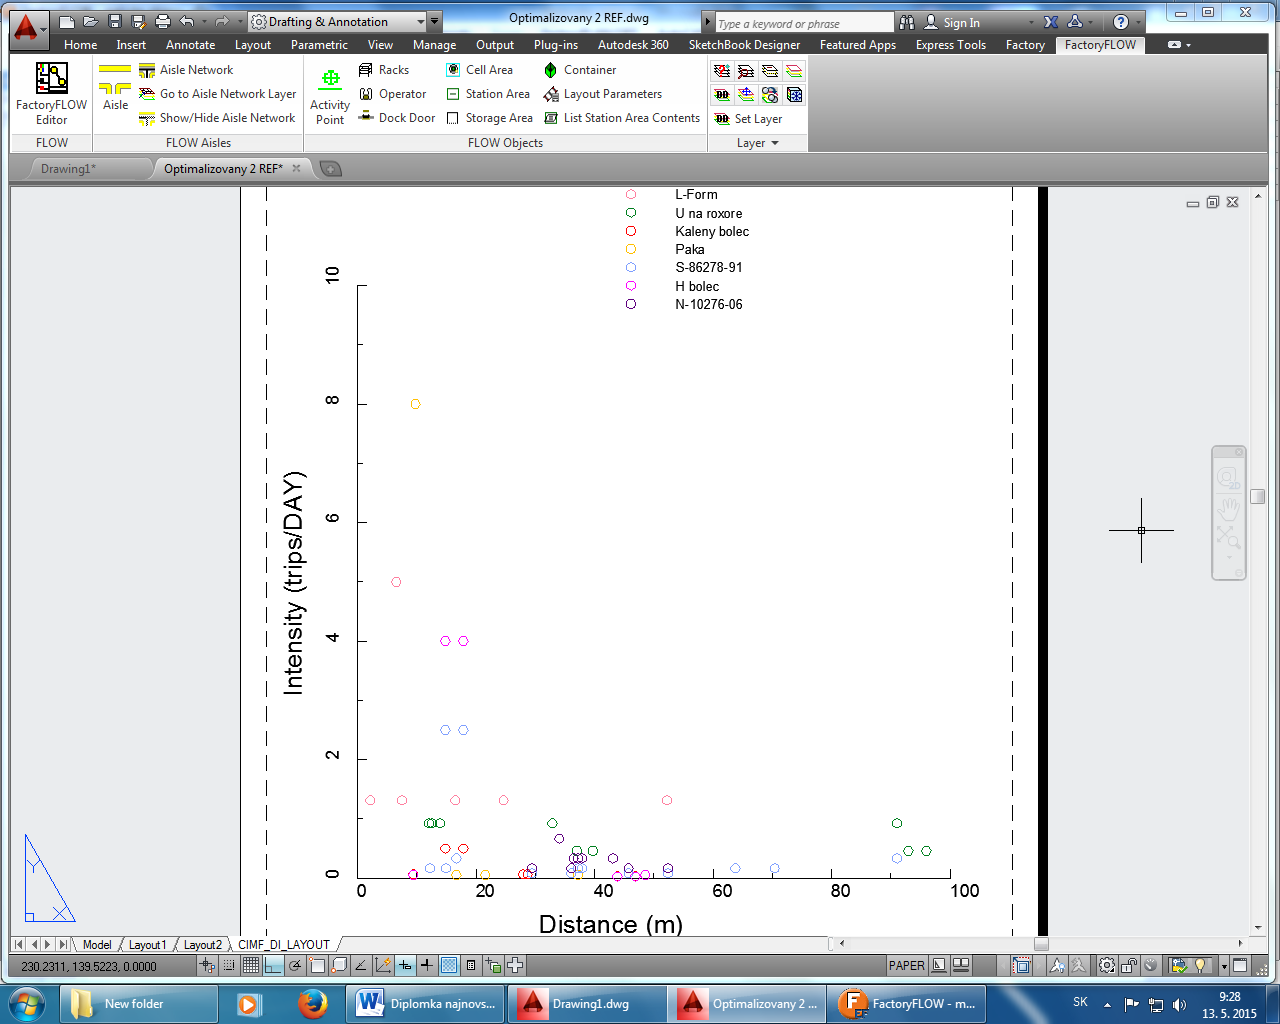
Distance Intensity diagram (DI diagram)- is a tool for the evaluation of material flows. This tool sorts the material flows depending on the intensity and distance of transport. Each point represents the relation between two objects. Body lying on the upper right are high transport costs and are considered to be unfavorable.
Reports - besides producing color-coded flow diagrams and graphs, FactoryFLOW allows you to create many types of detailed reports on the layout, material flow, time and cost saving comparisons.
CONTROLL AND MONITORING OF LOGISTICAfter implementation of designed production and logistic system it is necessary to choose right strategy for its control and monitoring. At our laboratory ZIMS (Zilina Intelligent Manufacturing System) we have developed our own solution. AGV Monitor & Control System is a system for monitoring and control of logistical resources.The system provides logistical resources with the ability to pass on information about their condition, current work, problem situations and positions within the allotted space. Collected information is displayed in a user-friendly form, mainly in the form of graphics that visualize the conditions and positions of logistical resources. AGV MCS uses this information for decision-making and subsequent management of individual parts of the logistics process for these logistical resources. The user has the possibility to influence and modify the elements of decision-making process in real time, and control their activation/ deactivation. System records and collects all information, operations (e.g. aic/manual), and setting changes for later analysis (e.g. errors) or use in optimizing the process. On the following picture AGV monitor 3D can be seen.
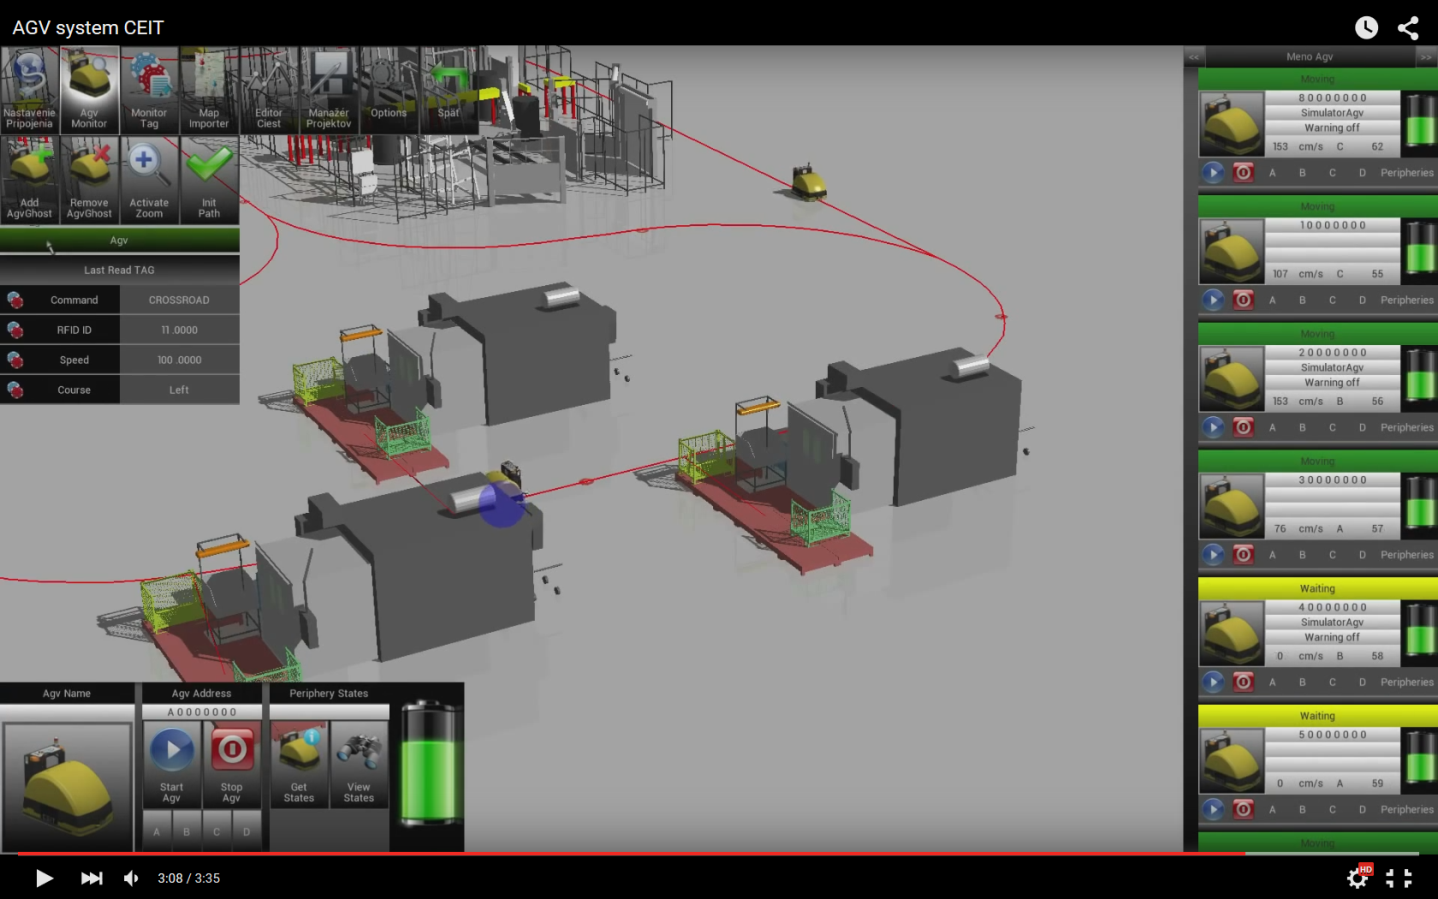
AGV monitor 3D provides an overview of activities, positions and events of AGV system in the production hall. AGV Monitor 3D is enhanced with 3D visualization of production hall with possibility to use a touch screen interface. Information can be shown in text, graphic or combined form. This information provides an overview of emerging events and their position in the production area, with the possibility of logging in real time. The added value is the possibility of mutual interaction between applications [10].
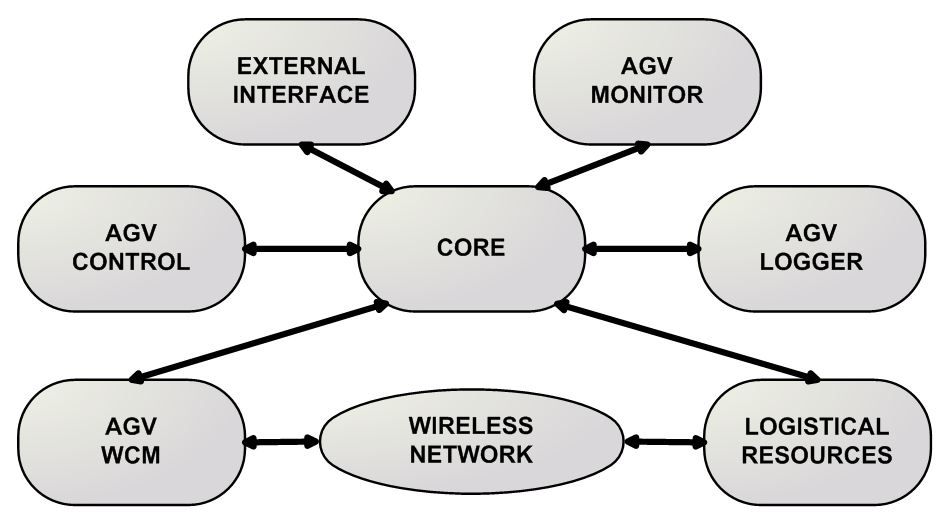
AGV Monitor & Control System is built on 6 main system modules (Fig.8.):
- Core - Central module, which connects the other modules.
- AGV Wireless Communication module - Communication between the Core and Wireless Network.
- AGV Monitor System - Monitoring and Supervision of Logistical Resources.
- AGV Control System - Automatic Control of AGV System Elements.
- AGV Logger - Records events and performed operations.
- External Interface - Provides communication with external applications.
Although many different software applications and modern technologies for the field of logistics exist, human with his knowledge is still the most important element for the successful design and planning of logistics systems. His early logistics analysis and optimal definition of supply chain is a key to the effective logistic processes. But using these technologies, companies can prevent unintended failure in case of improper design of material flows and verify their designs before it`s integration into reality. In the laboratory of Zilina Intelligent Manufacturing System (ZIMS), common workplace of University of Zilina and Central European Institute of Technologies (CEIT) we are implementing these existing software and developing new solutions for industry. ACKNOWLEDGMENT This paper was created with support of APVV project: APVV–14-0752: Reconfigurable logistic system for new generation of Factory of the Future manufacturing systems (RLS_FoF). REFERENCES [1] FURMANN, R., ŠTEFÁNIK, A.: Progresívneriešenia pre podporuprojektovaniavýrobných a logistickýchsystémovvyvíjané v spoločnosti CEIT SK, s.r.o., In: Produktivita a inovácie :dvojmesačníkŽilinskejuniverzity v Žiline v spolupráci so Slovenskýmcentromproduktivity a Ústavomkonkurencieschopnosti a inovácií. - ISSN 1335-5961. - Roč. 12, č. 2 (2011), s. 3-5. [2] FURMANNOVÁ, B., FURMANN, R.: Modernýprístup k projektovaniumontážnehopracoviska, In: Technológ: časopis pre teóriu a praxmechanickýchtechnológií. - ISSN 1337-8996. - Roč. 4, č. 3 (2012), s. 37-40. [3] KRAJČOVIČ, M. et al.: Intelligent Manufacturing Systems in concept of digital factory, In: Communications : scientific letters of the University of Žilina. - ISSN 1335-4205. - Vol. 15, no. 2 (2013), s. 77-87. [4] MIČIETA, B., BIŇASOVÁ, V., HALUŠKA, M.: The approaches of advanced industrial engineering in next generation manufacturing systems, In: Communications : scientific letters of the University of Žilina. - ISSN 1335-4205. - Vol. 16, no. 3A (2014), s. 101-105. [5] www.siemens.com/tecnomatix [6] SR Yadav, N Mishra, V Kumar, MK Tiwari: A framework for designing robust supply chains considering product development issues, International Journal of Production Research, 2011 [7] Furmann, R. – Krajčovič, M. 2011. Modern approach of 3D layout design. In TRANSCOM 2011. Žilna : University of Žilina, 2011. ISBN 978-80-554-0370-0, s. 43-46. [8] Mičieta,B., Dulina, Ľ.: Progressive work place design, In: New aspects of manufacturing organizations´ development - Žilina: CEIT, a.s., 2011. - ISBN 978-80-970440-2-2. - S. 71-96. [9] Micieta,B., Binasova,V., Haluska,M.: System for support the design and optimization of reconfigurable manufacturing systems, In: MM science journal. - ISSN 1803-1269. - March (2015), s. 542-546. [10] ĎURICA, L. – MIČIETA, B. – BUBENÍK, P. – BIŇASOVÁ, V. 2015. Manufacturing multi-agent system with bio-inspired techniques: CODESA-PRIME. In MM (Modern Machinery) Science Journal. ISSN 1805-0476, December 2015, no. 4, s. 829 – 837. AUTHORS: [1]Ing. Jozef Hnát, PhD. University of Žilina, Faculty of Mechanical Engineering, Department of industrial engineering, Žilina, Slovakia, jozef.hnat@fstroj.uniza.sk [2]Ing. Jozef Herčko, University of Žilina, Faculty of Mechanical Engineering, Department of industrial engineering, Žilina, Slovakia, jozef.hercko@fstroj.uniza.sk